Hi
The experimental setup involved a helium neon laser of wavelength 670nm +- 1nm, pointed towards a lens with focal length 500mm +- 1mm. (so that the equations used corresponded to the far field diffraction pattern) and onto a photo diode so that for all intents and purposes the voltage is proportional to the Intensity.
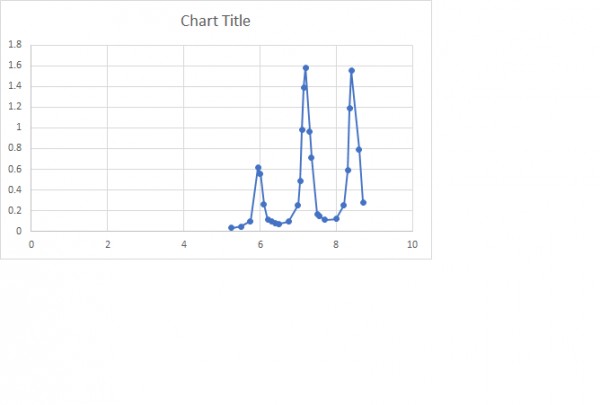
For a diffraction coarse grating consisting of a large number of slits, i collected data approximately 30 point.
I am attempting to plot a graph of the intensity as a function of distance on python but have not been able to produce the fit yet, so am attaching a dot to dot fit produced on excel to contextualise the results, where on the x axis i have position and on the y axis i have intensity(voltage).

I am using this equation
I(x)=4I0cos2(πaxλf)[sin(πaxλf)πaxλf]2
which is a product of double slit interference and single slit diffraction.
From this I what to determine the finite distance of the slits (a) and the distance between the slit seperation (d).
Xm=mλfd
Xm=m+12λfd
I believe I also need to use the equations which describe the distance between successive maxima and minima respectively.
Can someone please explain how to obtain the values of a and d, from these equations and (potentially my data plot, additionally if anyone has any knowledge on python and could tell me what function i need
 Q&A (4906)
 Reviews (205)
 Meta (440)
 Q&A (4906)
 Reviews (205)
 Meta (440)